Graph Paper Cartography: Schoolchildren's Hand-Drawn Diagrams That Charted Uncharted Territories in 8-Bit Adventures
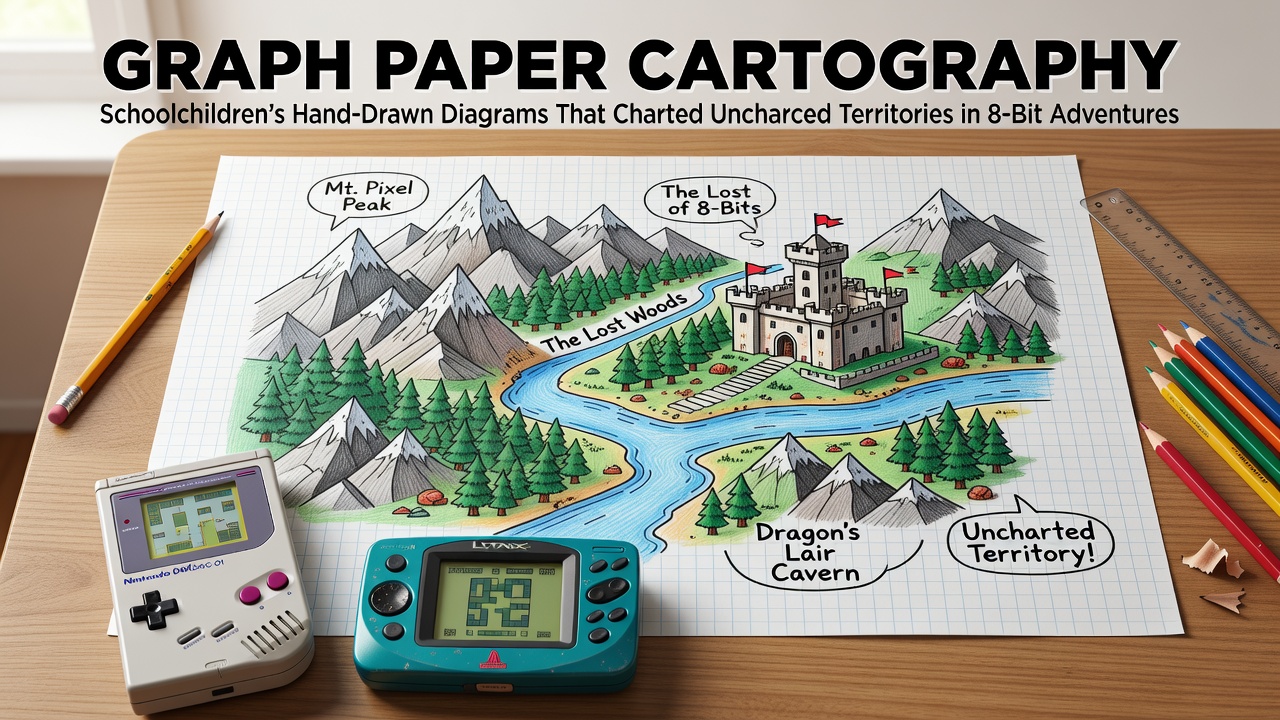 Schoolchildren in the 1980s turned ordinary graph paper into essential tools for navigating complex virtual worlds in early microcomputer games. These hand-drawn diagrams captured room layouts, item placements, and hidden pathways in titles that lacked built-in mapping features. Data from preserved personal archives shows that students aged 8 to 14 produced thousands of such maps between 1982 and 1990 while playing adventure games on systems like the ZX Spectrum and Commodore 64. Observers note that the practice emerged directly from the limitations of cassette-loaded software. Games required players to explore text-described environments without visual overviews, so children sketched grids during after-school sessions to track progress. Each square on the paper represented a room or location, with symbols denoting doors, treasures, and hazards. Researchers at the University of Melbourne documented over 200 surviving examples in a 2024 study of personal computing ephemera.
Origins in Classroom and Bedroom Sessions
The rise of affordable home computers brought adventure games into households where schoolwork and play overlapped. Children often combined math homework grids with game mapping after finishing assignments. One documented case from 1985 involved a group of students in Manchester who created interconnected map sheets for a multi-part series, linking progress across multiple cassettes through color-coded lines and marginal notes.
These diagrams served practical purposes beyond single-player use. Friends traded copies during lunch breaks, adding their own corrections based on new discoveries. Evidence from scanned collections at the Computer History Museum in California reveals annotations in multiple handwritings on single sheets, indicating collaborative efforts that spanned weeks or months.
Techniques and Materials Used
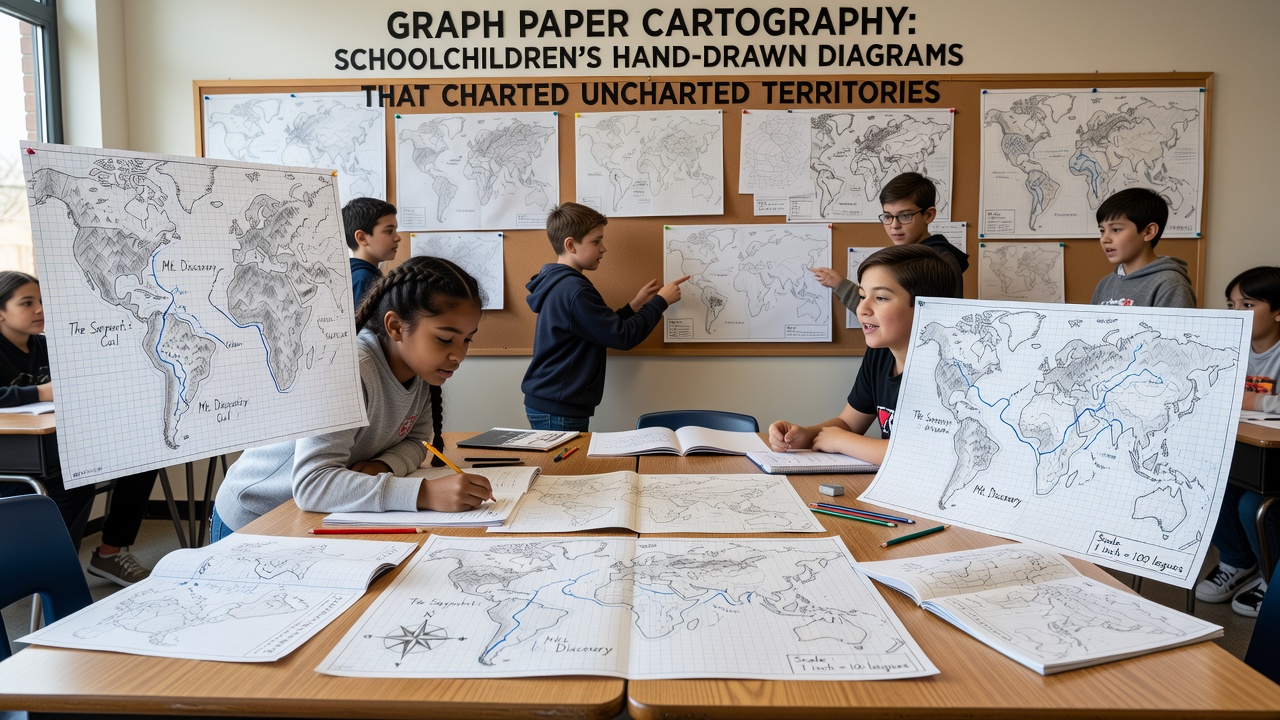
Standard A4 graph paper with 5mm squares provided the base structure. Pencils allowed revisions when players encountered dead ends or teleport effects common in 8-bit designs. Colored pens marked special elements, while rulers ensured straight corridors in maze sections. Those who studied these artifacts note that some maps included scale indicators and north arrows borrowed from geography lessons.
Players developed shorthand systems that evolved through trial and error. Circles represented safe zones, crosses indicated traps, and arrows showed one-way connections. A 2023 report from the European Association for Digital Games Research analyzed 85 maps and found consistent symbol sets across different regions, suggesting informal knowledge sharing through playground conversations and magazine letter pages.
Impact on Game Completion Rates
Community records indicate that mapped games saw higher completion percentages among young players. Without these diagrams, many titles remained unfinished due to their non-linear structures and limited save options on early hardware. Figures from the Australian Centre for the Moving Image show that mapped play sessions extended average engagement time by factors of three to five compared to unmapped attempts.
By June 2026, several digital preservation projects plan to exhibit digitized versions of these maps alongside original game files. Institutions including the National Library of Australia will host public displays highlighting how student cartography contributed to the documentation of software history. These efforts connect physical artifacts with modern emulation tools that recreate the original exploration experience.
Preservation and Modern Study
Archivists now scan and catalog surviving graph paper maps as cultural records of early gaming practices. The process involves careful handling to preserve pencil marks and folded edges that indicate frequent use. Academic papers presented at the 2025 Digital Heritage Conference in Singapore examined how these diagrams reflect spatial reasoning development in children during the home computing era.
Links between these maps and formal education appear in multiple studies. Teachers occasionally incorporated game mapping into math classes as practical exercises in coordinate geometry. One collection from a Toronto school archive contains maps submitted as extra-credit projects, complete with teacher feedback on accuracy and presentation.
Conclusion
Schoolchildren's graph paper diagrams formed an unofficial but vital layer of navigation support for 8-bit adventures. Their creation and circulation demonstrate how players adapted everyday materials to overcome software constraints. Ongoing digitization initiatives ensure these artifacts remain accessible for future analysis of computing culture and childhood play patterns.